


Ticket Source
Downloads: 0
Use Cases | Key features | User's Manual | Package installation | Configuration | System requirements | Roadmap
Use Cases
Ticket source storage and reporting – e-mail, portal, phone
Key features
- Store the source of ticket in dynamic field
- Ticket source based dashboard widget. Various filters are available:
- In queues
- By services
- By type of tickets
- By period
User's Manual
To view the module, go to the “Dashboard” menu (Figure 3.1), then in the “Parameters” section turn on the “Ticket Timing by Source” widget and click the “Save settings” button (Figure 3.2).

Figure 3.1. Menu “Dashboard”
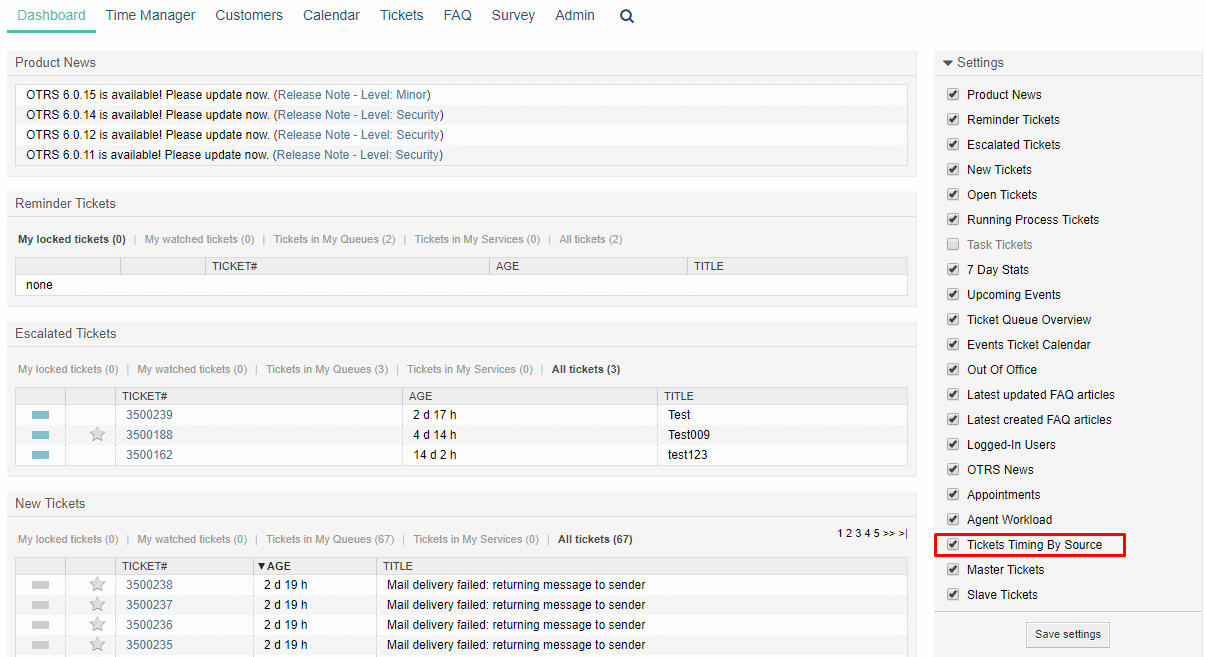
Figure 3.2. Widget turn on
A widget is a diagram (Figure 3.3) with statistics on the distribution of tickets by registration source:
- Vertical diagram scale: number of tickets
- Horizontal diagram scale: periods of time. The following time intervals are available:
- Hour (0-24)
- Day of the week (Monday - Sunday)
- Day of the month (1-31)
- Month (January - December)
The diagram column shows the number of tickets for the time interval by source:
- Telephone
- Portal
Each source is marked with a different color, colors editing in the settings is available.

Figure 3.3. Widget “Distribution of tickets by source”
To the left of the diagram is a filter block:
- By queue (queue selection list)
- By type of tickets (list of types of tickets)
- By service (selection list of services)
-
Diagram type:
- Bar chart (default value, example in Figure 3.3)
- Line chart (example in figure 3.4)
- Period of time - the period of time for which statistics are displayed on the chart:
- Week
- Month
- Quarter
- Six months
- Year
- Selection - selection of the date interval “from” - “to” (only one of these parameters can be selected, for example, “to 12.12.2018”). An example is shown in Figure 3.5.

Figure 3.4. Diagram display as a line chart
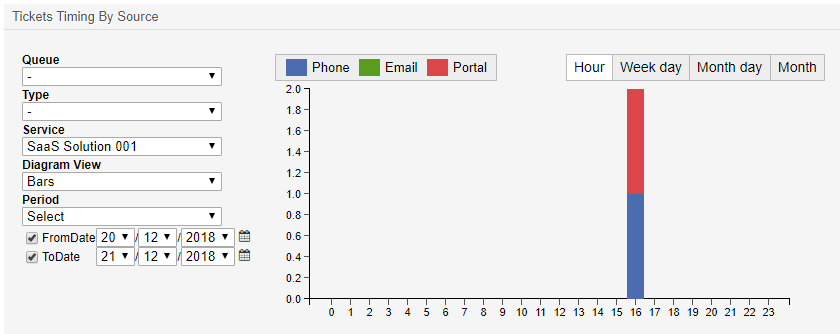
Figure 3.5. Choosing a period of time which displays statistics
Package installation
Please use the following URL to install the package utilizing the Admin Interface (please note that you need to be in the "admin" group).
http://your-server/otrs/index.pl?Action=AdminPackageManager
The steps for installing the package are described in the official OTRS instructions for the Administrator.
Configuration
The package can be configured via the System Configuration in the Admin Interface. The following configuration options are available:
- GraphColors::TimingBySource
GraphColors::TimingBySource
This setting determines the colors of the sources of tickets on the Dashboard widget.
The colors in the settings are listed sequentially in order: Phone, E-mail, Portal.

Figure 5.1. System configuration
System requirements
Minimal requirements to hardware for OTRS:
- Processor 3 GHz Xeon or comparable
- RAM 8 GB RAM
- Disk space 256 GB
Software requirements:
- OTRS Community Edition 6.0
Roadmap
07/11/2019 v.6.0.1
- Fixed the incorrect display of applications within the day of the week, day of the month and by month.